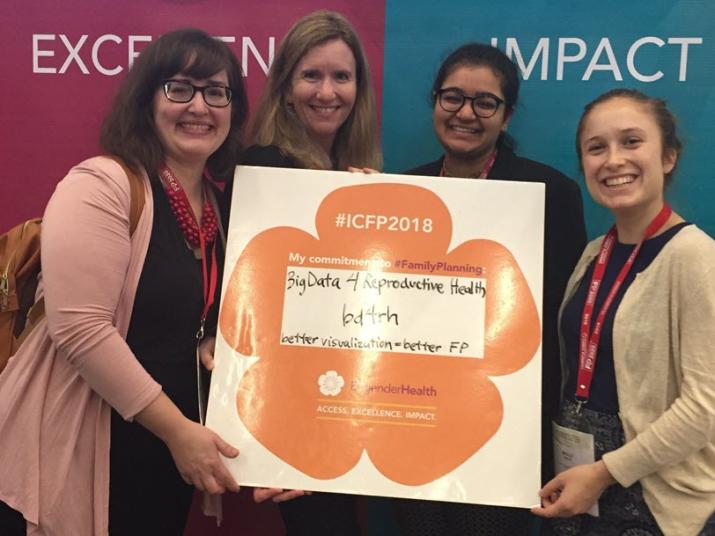
Members of the Big Data for Reproductive Health team at the International Conference on Family Planning in Kigali, Rwanda in November 2018. From left: Amy Finnegan and students Kelly Hunter, Saumya Sao and Molly Paley. Not pictured: team co-lead Megan Huchko.
Published December 14, 2018, last updated on December 18, 2018 under Research News
By Susan Gallagher
Amy Finnegan likes to think of herself as the “Swiss Army knife” of researchers. When a research opportunity arises, she thinks, “I’ve got a randomized control trial, I’ve got qualitative data, I’ve got big data, etc. What’s the best way to find an answer to this question?”
Finnegan has spent the past ten years building her research toolbox through graduate programs at New York University’s Wagner School of Public Service and Duke’s Sanford School of Public Policy, and now through her varied roles and projects across Duke. She’s a research scholar at the Duke Global Health Institute, the Evidence Lab, the Center for Global Reproductive Health at Duke and the Social Science Research Institute. She also coordinates the Education & Human Development Bass Connections theme, which supports interdisciplinary research teams of faculty and students who engage in problem-centered research.
We recently caught up with Finnegan to learn more about her approach to research and why she thinks big data is a big deal for global health.
You describe yourself as a social demographer. What does that mean?
I’m interested in the intersection of population health—which is about gender and age and natural relationships—and demography, which some people sum up as “births, deaths and travel [i.e., migration].” I’m particularly interested in exploring what factors lead to higher fertility and mortality. For example, is it the political system, is it individual behaviors, is it that interventions exist but people don’t have access to them, or is it that they’re choosing not to access existing interventions?
My research also focuses on how people can translate their intentions into action. For example, my dissertation was on maternal mortality in Indonesia, where maternal mortality is quite high, but since the country has such a large, geographically dispersed population, an individual woman may not be exposed to the risk of dying in childbirth. It’s not very salient to them. So I looked at the Demographic and Health Survey (DHS) data and what choices a woman makes when her sister dies in childbirth. Does it change where she's going to get care at the time of delivery? Does it change her fertility intentions? And then I looked at how these data could translate to policy, like what kinds of messages might deter women from giving birth at home or without a skilled birth attendant.
The Bass Connections research project you co-lead is called “Big Data for Reproductive Health.” What exactly is big data and why is it creating such a buzz in fields like global health?
Big data is the “three Vs”: volume, velocity and variety. Volume is that we have data from multiple points in time, not just a cross-section. Velocity because it’s collected sometimes by the second, versus at set intervals of five or 10 years such as a population-representative survey or a census. And variety because big data incorporates a wide range of data—from quantitative data to things like images and sounds.
In the U.S., big data in health usually comes from electronic medical records, and a lot of low-income countries don’t have electronic medical records. But you can get systematic observations on an individual or a problem through devices like wearable sensors and mobile phones, which have been used quite a bit in global health research.
A good example of big data is the DHS, which we’re using for the Bass Connections project. It’s a USAID-funded project that collects a huge amount of health data every five years from nearly every low-income country. And even though it’s collected only every five years, women are reporting monthly on retrospective data. They’re asked questions about births they’ve had in the last five years, whether they received prenatal care, where they delivered their babies, things like that. And the response rate is over 95 percent, so it’s an excellent big data source.
The big data buzz is exciting because it enables us to “teach old data to do new tricks,” as I heard someone say recently. The DHS has existed for more than 30 years, but we’re doing a new analysis using the data. Advances in computing and methodological advances in machine learning have recently made this kind of research possible in a way that wouldn’t have been when the DHS was created.
Tell us more about how you’re using big data in the Big Data for Reproductive Health project.
In this project, as I mentioned earlier, we’re using the DHS. Specifically, we’re looking at the “contraceptive calendar.” Because it’s a pretty gnarly data set to work with, it’s been difficult to get this data on women’s contraceptive use into the hands of people who can use it for decision making. We envision our work being used by family planning researchers and advocates.
In the first phase of our project, we’ve been looking at descriptive monthly and yearly trends in contraceptive use and discontinuation, which we’ve curated into an online, user-friendly tool that our users can access to explore trends themselves. We’re using the R Shiny platform to visualize data patterns, and it’s just a great, versatile way to interact with your data.
From the visualizations we created, we noticed that every December, a large number of women are discontinuing contraceptive injections in Kenya. We wouldn’t have picked up on this pattern without visualizing the data. We’re now exploring the implications of this jump in discontinuation rates for these women; one likely implication is unwanted fertility if quitting is not a decision in their control. We’re also looking into whether or not December “quitters” later re-engage with family planning, which can have important health policy consequences.
In the second phase, we’ll apply machine learning methods to figure out if there are clusters of women with different trajectories—for example, groups of women we might call “switchers,” who switch from method to method over the observation period, or “quitters,” who start a method but stop for long periods of time, or “planners,” who have a few kids, start using contraception and never quit. And then we’ll use other machine learning approaches to see if there are characteristics that predict these trajectories. It’s a way to summarize a lot of disparate data. If we can predict specific trajectories, we could use that information to create more targeted interventions and policies. That’s where we’re ultimately hoping that big data can really have a real world impact.
Learn more:
- Read about the Big Data for Reproductive Health project.
- Learn more about Amy Finnegan.


