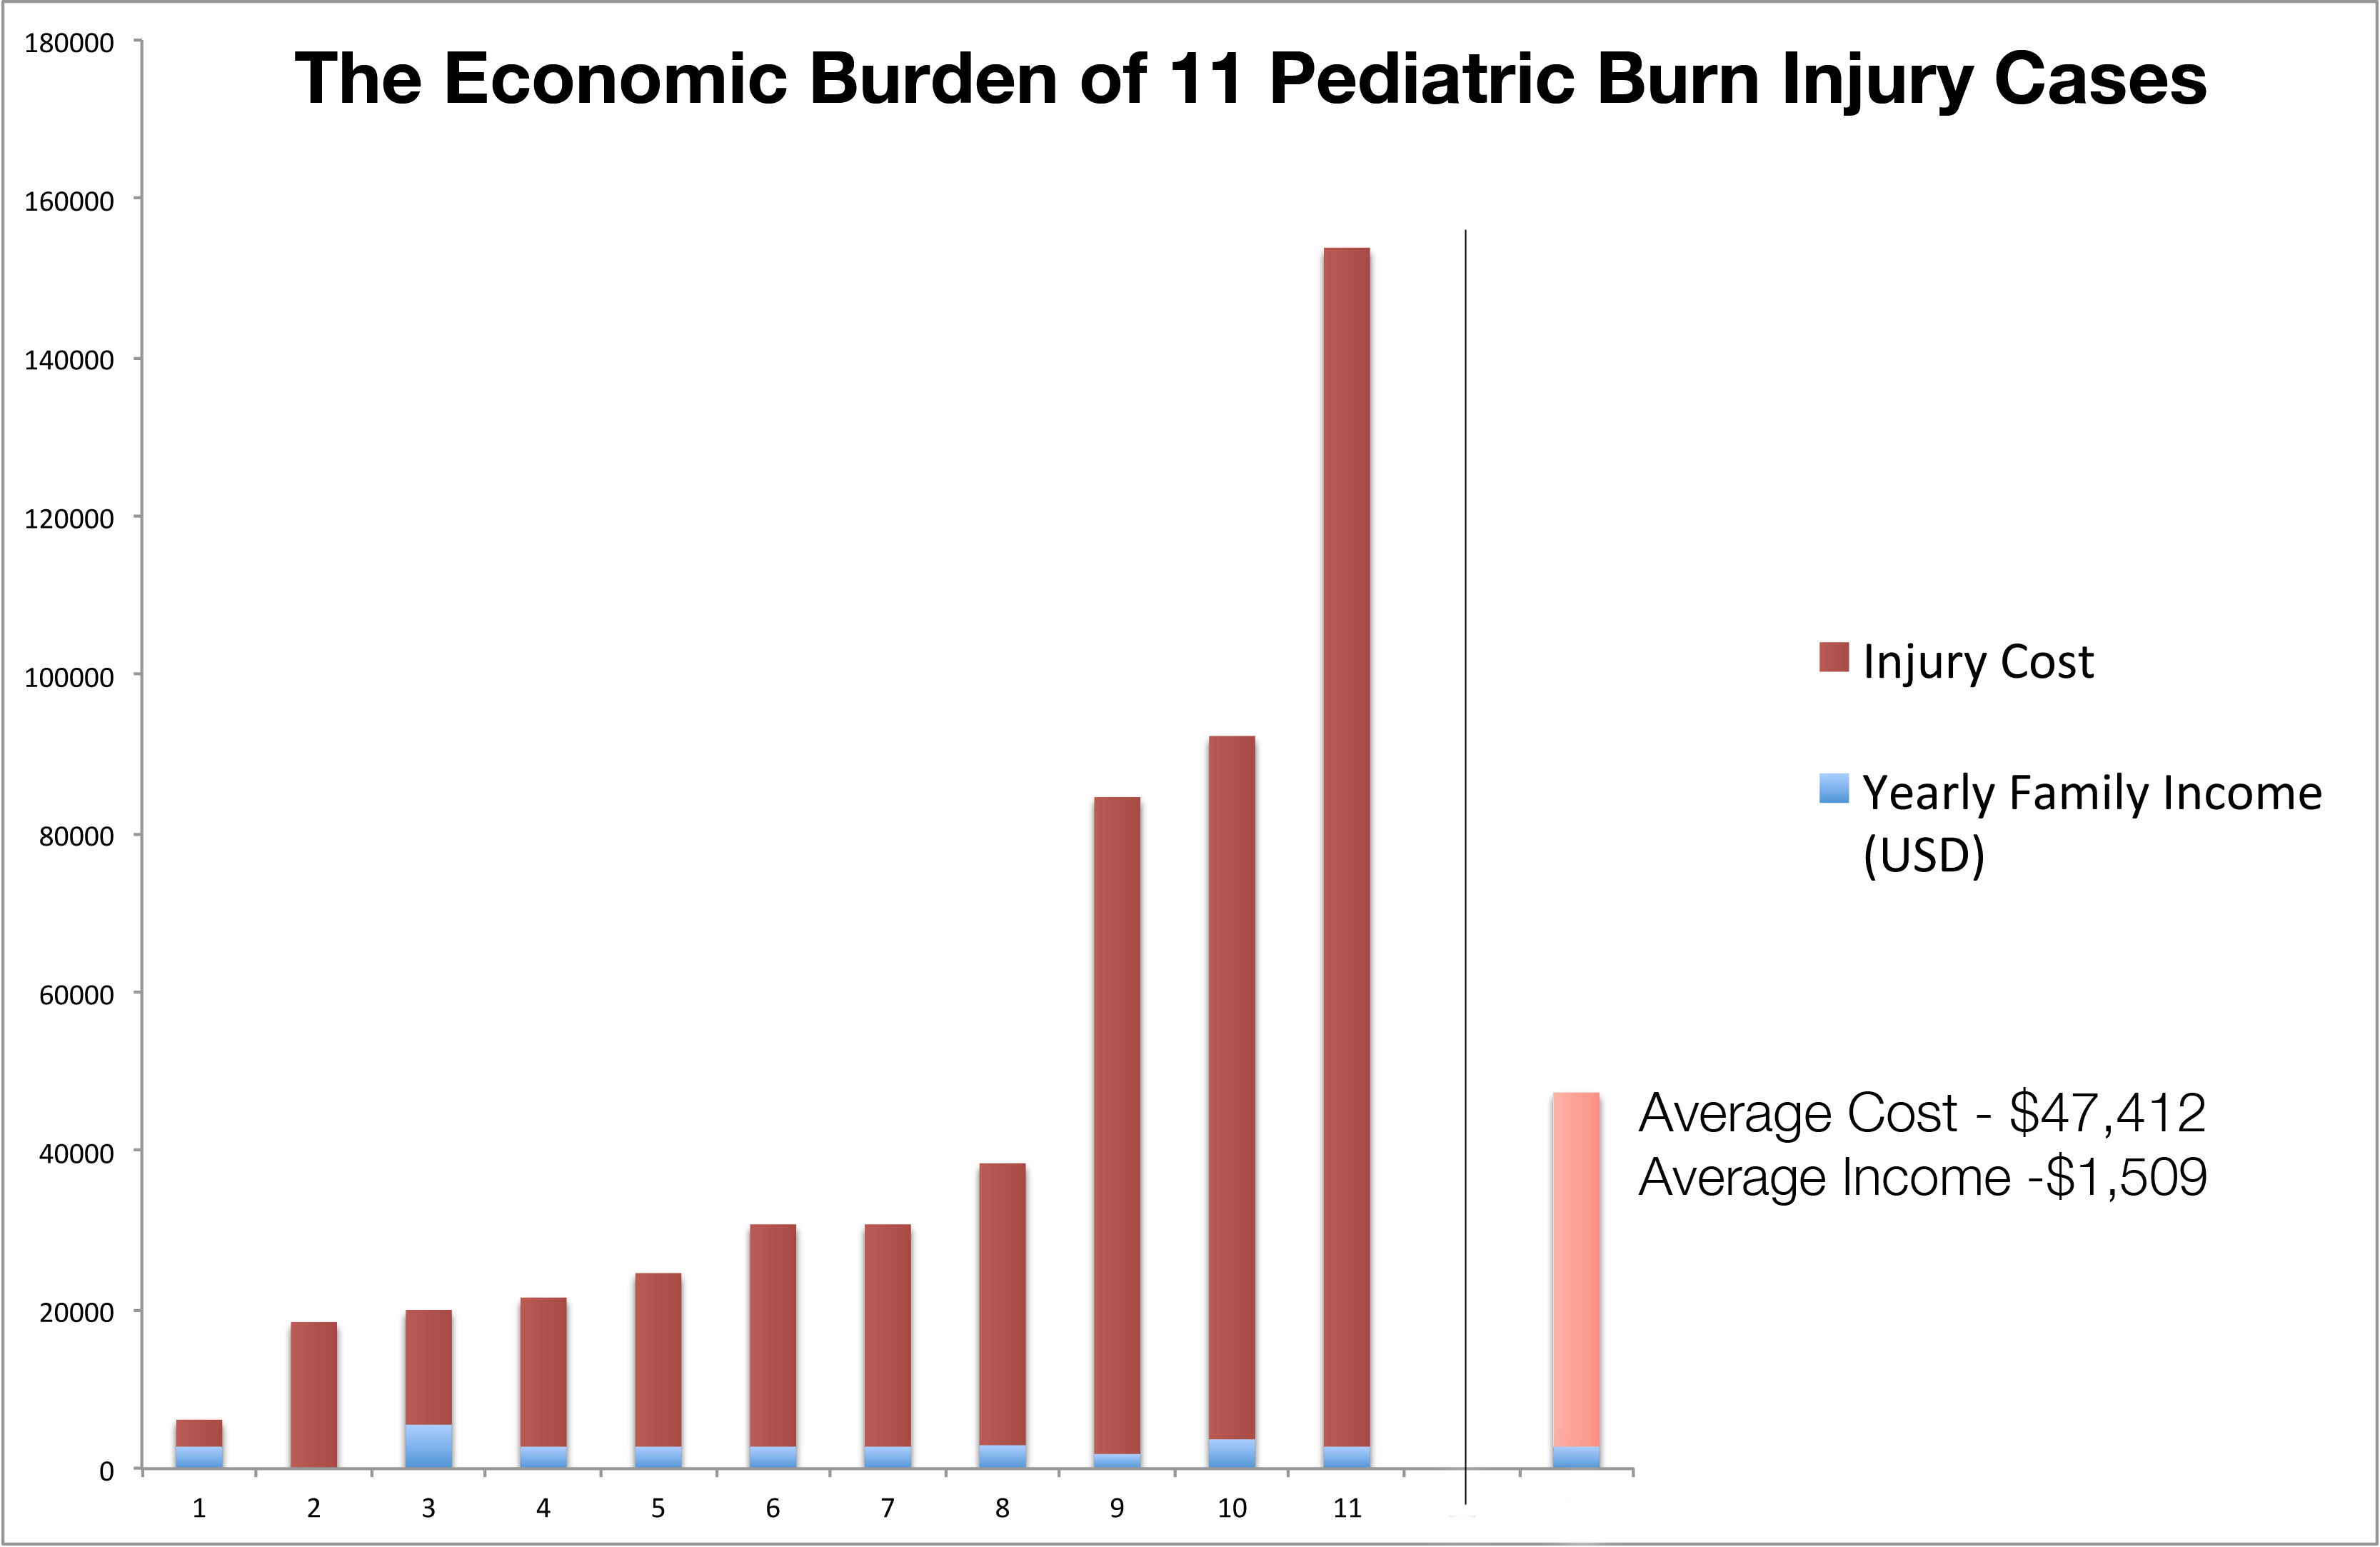
Andrew Wu Economics 2012 Now normally I wouldn't be sharing excel graphs with people over the internet, but these graphs that I've made from my interviews from China are just too shocking to not share. So scroll down below if you are interested. The first show the huge differential between the injury cost and their yearly family income. I have converted everything into US dollars for those interested to get a better grasp on the sheer scale of these injuries. Of course, these are very severe injuries, and a common 1st or 2nd degree burn will not cost this much to treat.
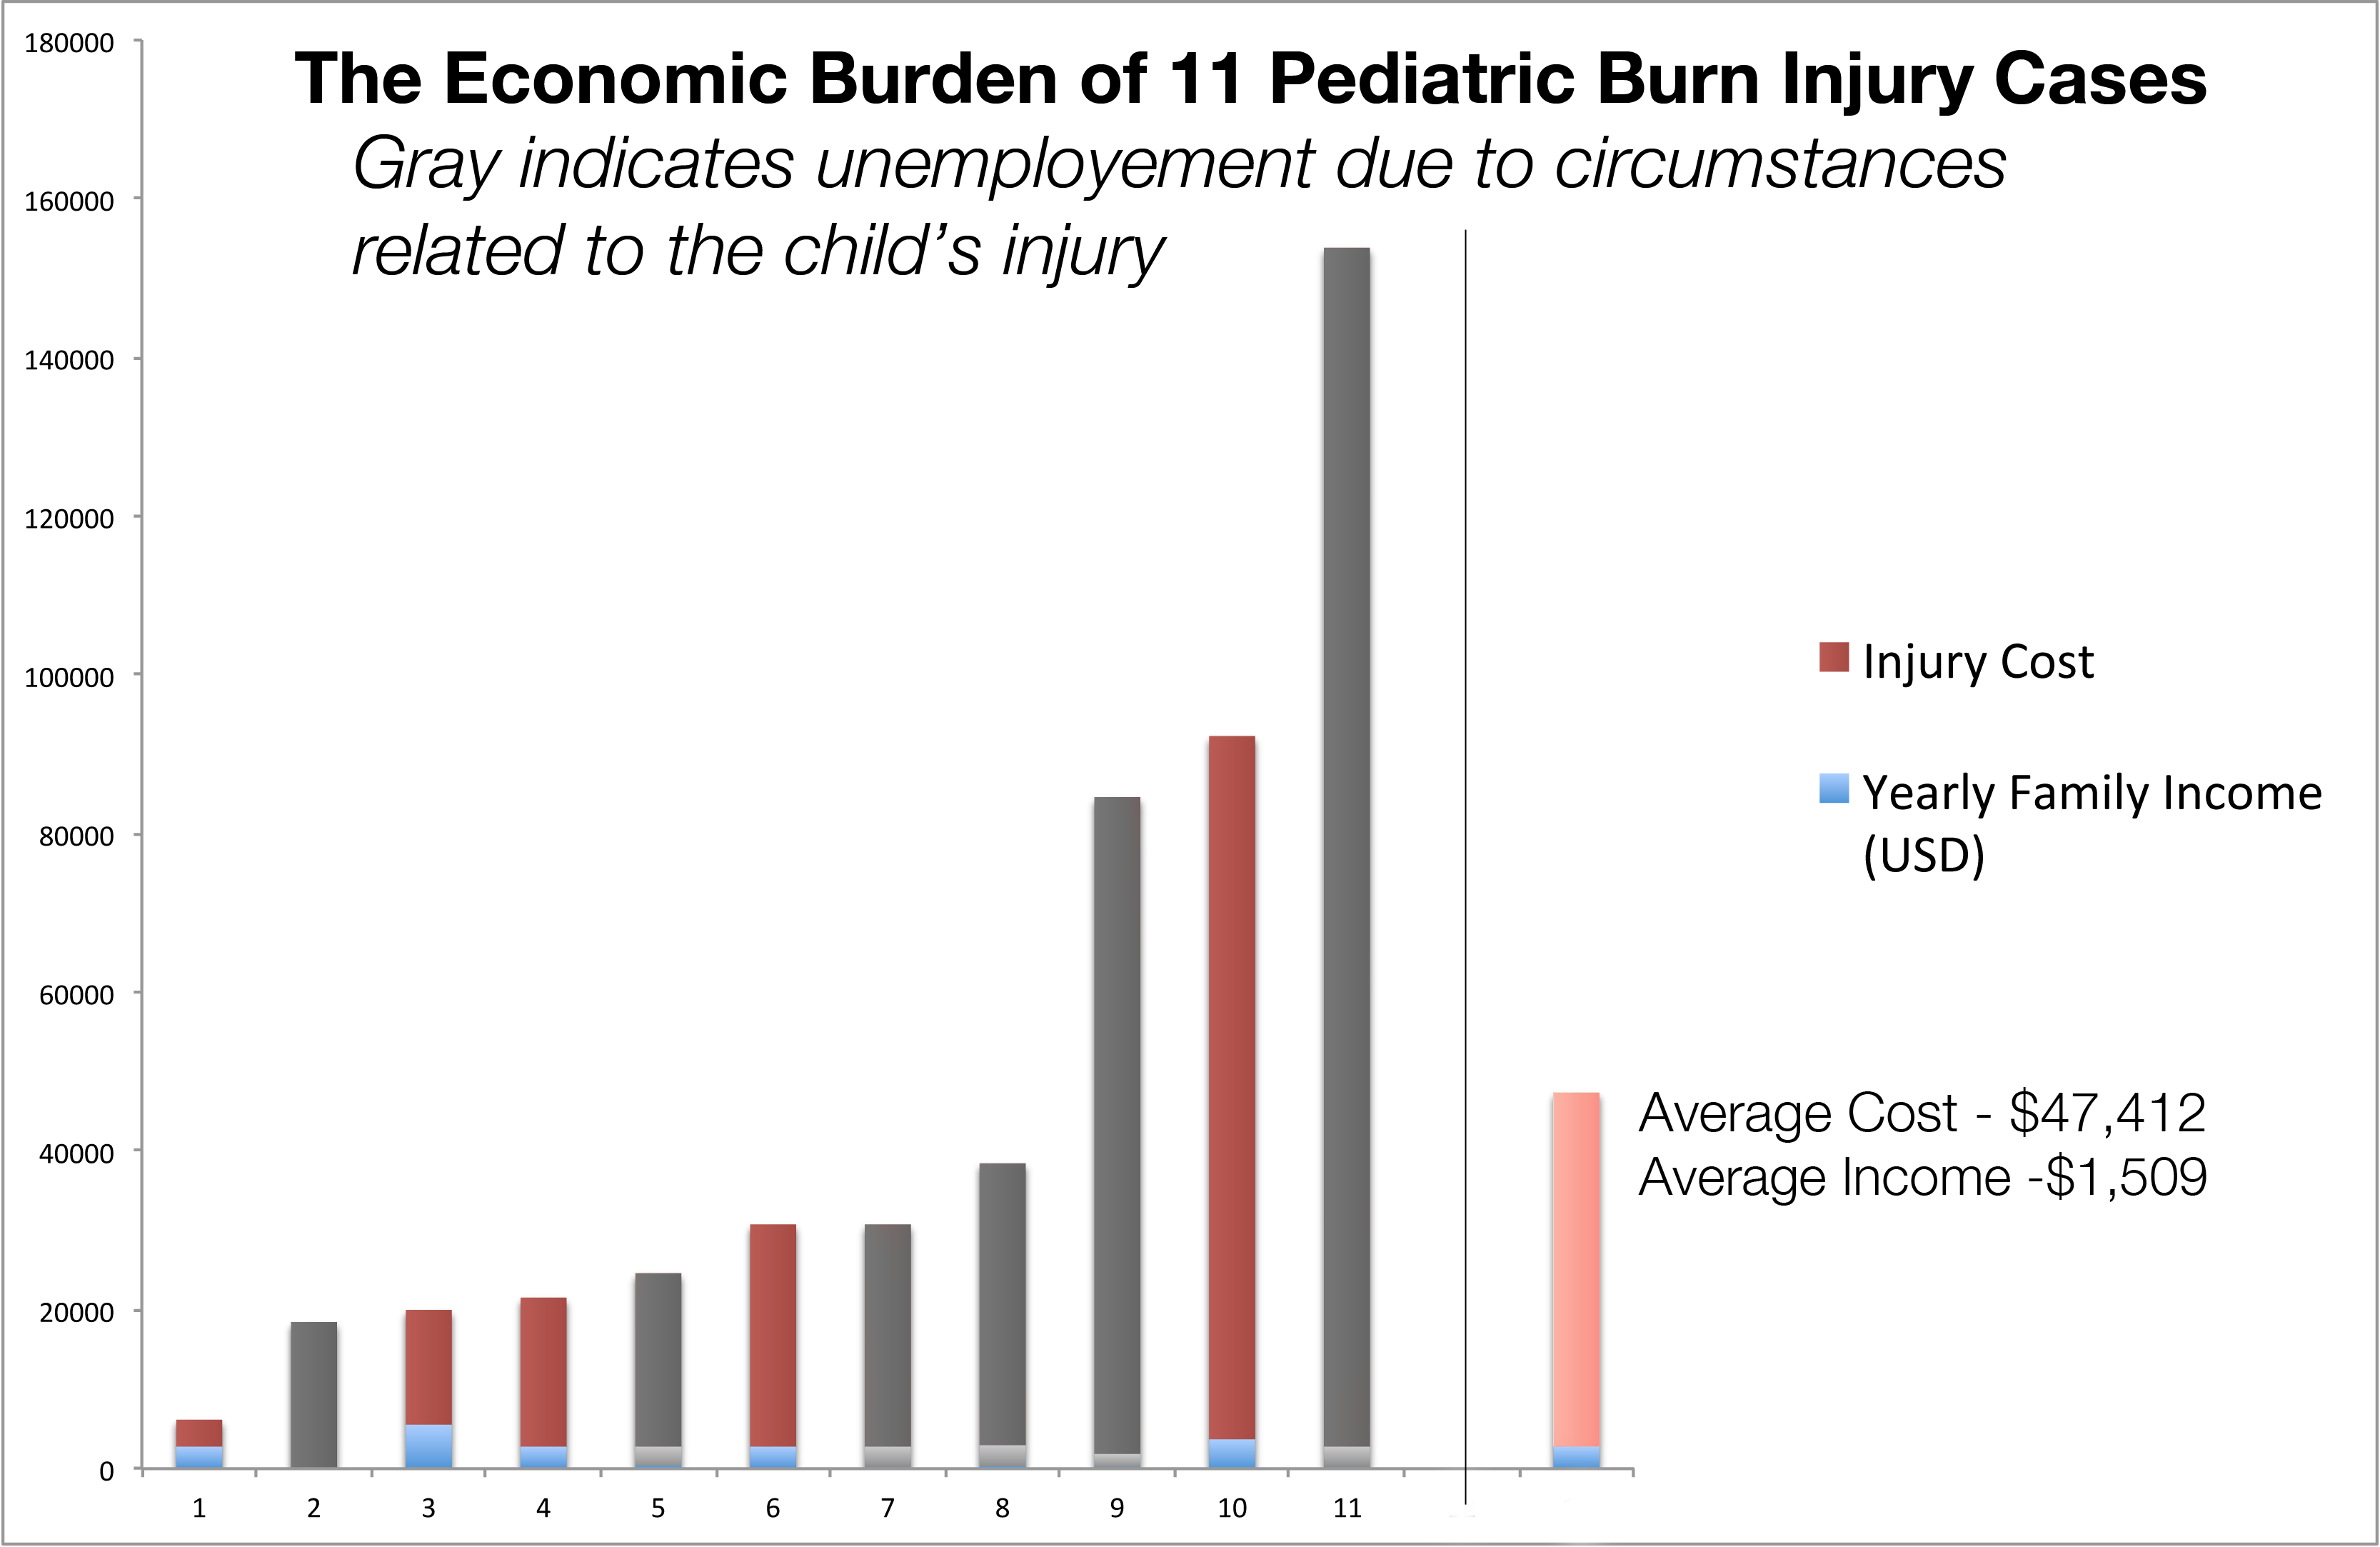
Where does this money go? This money goes for material costs related to medicines, skin graft surgeries, physical rehabilitation, and the general manpower needed to monitor these patients on a round the clock basis when patients are injured this severely. Furthermore, there are other opportunity costs associated with the injury, which prevent the parents from working, due to either having to take care of the child in the hospital, or being injured in the accident as well. This is shown below.
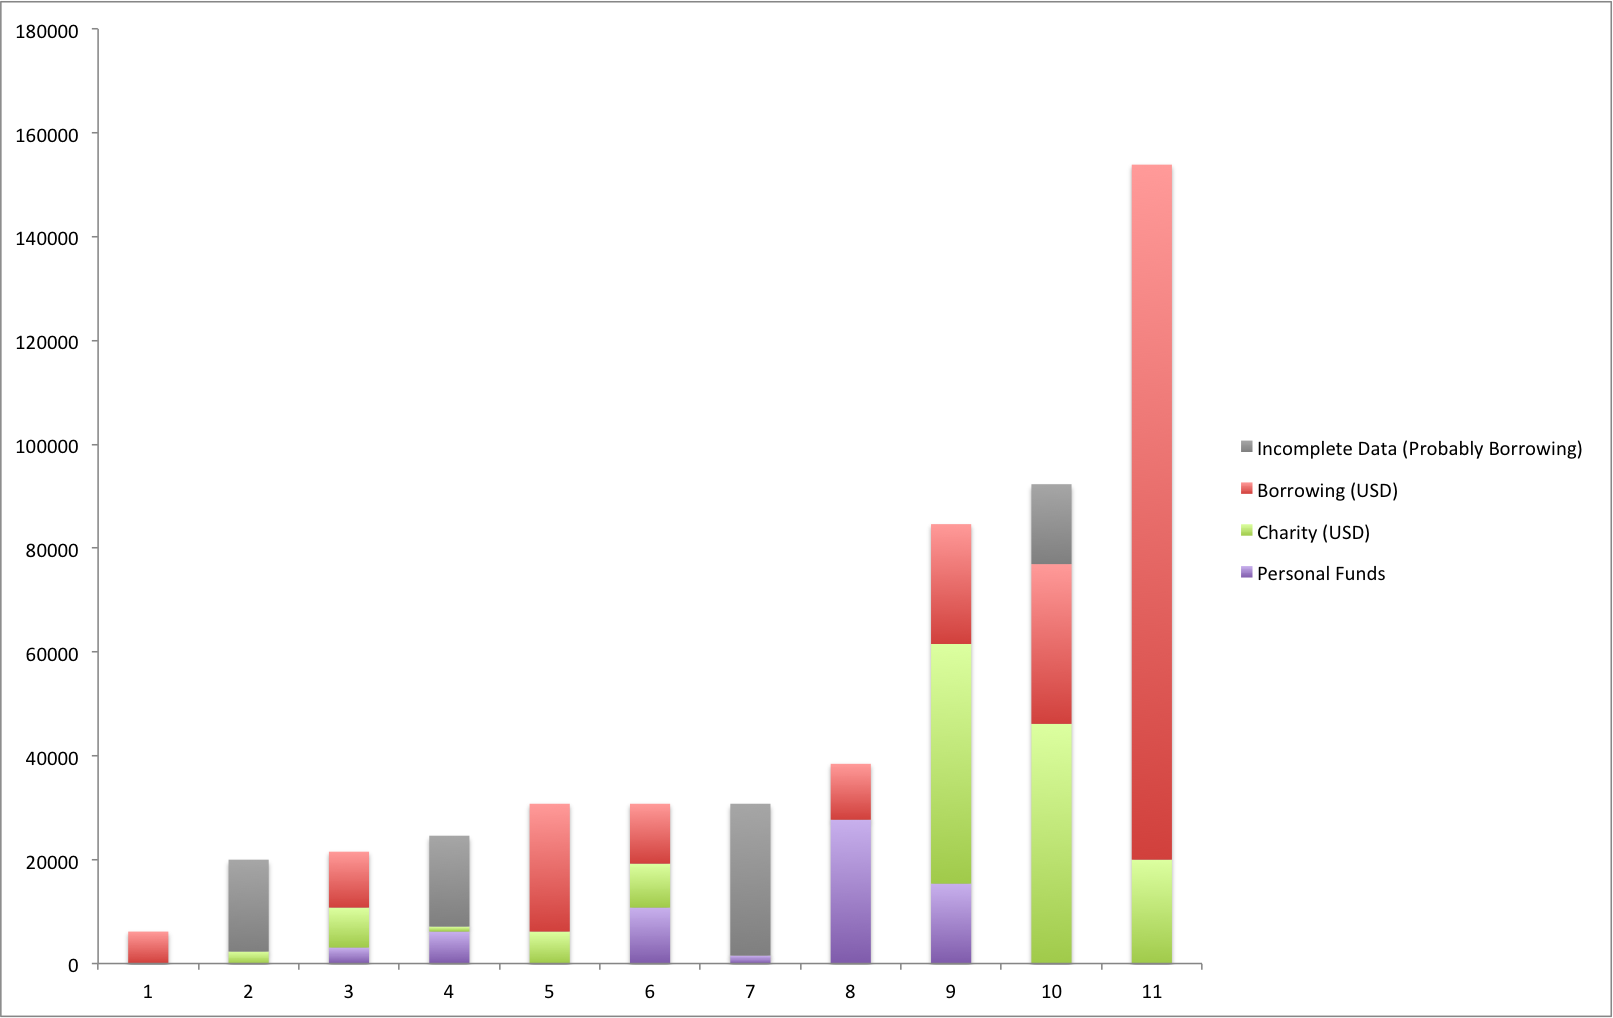
So what is a parent to do to pay for this treatment? A combination of borrowing, charity request, and exhausting their own personal funds; and if you can see below, none were able to pay for the treatment in full.
And for a more specific and colorful candy-colored breakdown of the source of funding, see below. (It's also more confusing as well; F/F borrowing means borrowing from friends and family)
Quite honestly I am still a little speechless after I made these graphs and can't say anything more about them.


